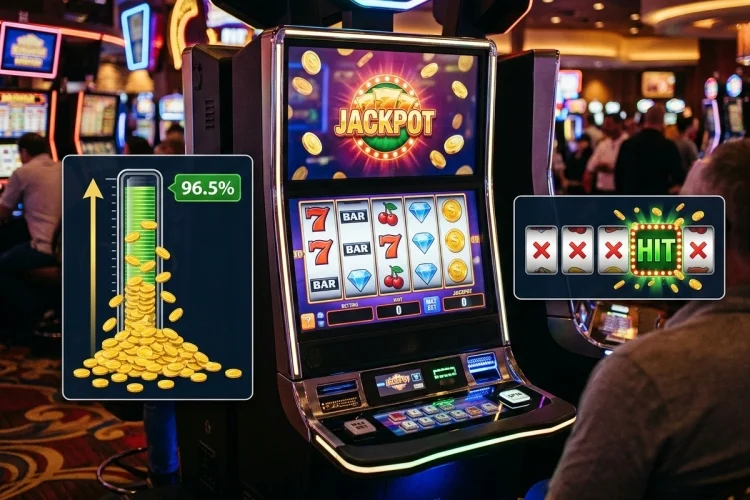
Slot games come with plenty of numbers, but two of the easiest to confuse are RTP and hit frequency. Both describe part of a game’s mathematics, yet they answer completely different questions.
Understanding RTP vs Hit Frequency can make slot information much easier to read. RTP describes how much wagered money a game is designed to return over a very large number of rounds, while hit frequency deals with how often qualifying winning results occur.
Neither figure tells you exactly what will happen during your next few spins.
What Is RTP in Slot Games?
RTP stands for Return to Player.
Gaming Laboratories International describes percentage RTP as the expected percentage of wagers that a specific game returns to players over the long run. GLI notes that the figure can be calculated theoretically or through simulation depending on the type of game.
Imagine a theoretical slot with a 96% RTP. Across an appropriately large mathematical sample, the game’s model is designed to return about 96% of wagers as prizes, leaving the remaining percentage as the mathematical house advantage.
That does not mean betting $100 guarantees $96 back.
The UK Gambling Commission explains that actual RTP can vary substantially from theoretical RTP over limited samples because of normal game volatility. As the amount of measured gameplay increases, observed RTP should generally move closer to its theoretical value.
What Is Hit Frequency?
Hit frequency answers a different question: how often does a spin produce a qualifying winning result?
The basic formula is:
Hit Frequency = Winning Spins ÷ Total Spins × 100
For example, suppose a mathematical model produces 250 winning results across 1,000 rounds. Its observed hit frequency for that sample would be 25%.
That does not mean every fourth spin will win.
Hit frequency is a long-run rate, not a timetable. Raijin Studio’s game-mathematics guide similarly distinguishes hit frequency – the rate at which winning results occur – from RTP, which concerns the value returned through those results.
This difference is the foundation of RTP vs Hit Frequency.
RTP Measures Value; Hit Frequency Measures Occurrence
The simplest way to separate the two concepts is to ask two different questions.
RTP asks: How much value is returned over the long run?
Hit frequency asks: How often does a qualifying result occur?
Consider two hypothetical games that both have 96% RTP.
Game A could produce relatively frequent smaller prizes. Game B could produce fewer winning spins while allocating more of its mathematical return to larger prizes or bonus features.
Their long-term RTP could therefore be identical even though the games feel completely different to play.
This is why comparing RTP alone does not tell you how often the reels will produce winning combinations.
A Hit Does Not Necessarily Mean a Profit
There is another important detail.
A winning result can sometimes return less than the original stake, depending on how the game’s reporting or rules define a credited win.
Imagine wagering $1 and receiving $0.40 from a qualifying combination. The game has produced a payout, but your net result for the round is still minus $0.60.
This means a game with a relatively high hit frequecy is not automatically more profitable.
Frequency tells you how regularly qualifying results occur, not how valuable those results are.
When hit-rate information is published, always check how the developer defines a “hit.” Definitions and reporting conventions can differ between games and providers.
How Volatility Fits Into the Comparison
RTP and hit frequency make more sense when volatility is added to the picture.
The UK Gambling Commission explains volatility using the statistical variation of game results. A highly volatile game can contain results in the “very large but rare” category, while lower-volatility designs generally contain more results in the “small and often” category.
That helps explain why two games with similar RTP figures can feel so different.
A lower-volatility design may distribute much of its return through smaller prizes. A high-volatility model can concentrate more mathematical value in less frequent larger outcomes.
Hit frequency contributes to that experience, but it is not exactly the same thing as volatility.
Prize size and distribution also matter.
Can Two Games Have the Same RTP but Different Hit Rates?
Absolutely.
Imagine Game A has a theoretical 96% RTP and a hypothetical hit frequency of 30%. Game B also has a 96% RTP but a hit frequency of 20%.
Across their mathematical models, both return the same proportion of total wager value.
Game A simply spreads qualifying payouts across more rounds, while Game B can distribute its return through fewer results with different prize sizes.
This simplified example demonstrates why RTP cannot be used as a substitute for hit rate.
Game mathematics involves several connected variables, including the paytable, symbol probability, bonus contribution, volatility, and maximum prize. GLI’s mathematical testing specifically evaluates RTP contributions from base games, features, jackpots, and game volatility.
Does a Higher Hit Frequency Mean a Better Slot?
Not necessarily.
A higher hit rate may create a feeling of more regular activity because qualifying combinations appear more often. Those combinations can still be small.
A lower hit rate may mean longer gaps between qualifying results while more mathematical value is concentrated elsewhere.
Neither structure is universally “better.”
They simply create different playing experiences.
The pratical approach is to compare RTP, hit rate when available, volatility, bonus structure, and maximum prize rather than choosing a game because one percentage appears attractive.
Why Short Sessions Can Look Completely Different
Long-run mathematical figures should never be treated as short-term promises.
Suppose a slot theoretically produces hits on 25% of rounds. Ten spins do not need to contain exactly 2.5 wins, and 100 spins do not have to contain exactly 25.
Random variation can push a short sample far above or below the theoretical rate.
The same applies to RTP.
The UK Gambling Commission demonstrates this with RTP monitoring: smaller samples allow much wider statistical variation around the theoretical figure, while larger samples normally create narrower tolerances.
A short session therefore provides very limited evidence about a game’s underlying mathematics.
Neither Number Predicts the Next Spin
RTP is not a countdown, and hit frequency is not a schedule.
The UK Gambling Commission requires applicable random game results to be acceptably random and prohibits adaptive behavior in which the game compensates based on previous results.
GLI also evaluates RNG systems using source-code review and statistical outcome-distribution testing.
So if a theoretical game has gone 10 rounds without a hit, that does not mean the next round has become “due.”
Similarly, several consecutive winning rounds do not mean the game has used up its wins.
These statistics describe the game’s design and long-run behaviour, not the timing of the next result.
RTP vs Hit Frequency is really a comparison between value and occurrence. RTP measures how much a game is theoretically designed to return over the long term, while hit frequency describes how often qualifying results occur.
Check both alongside volatility and game rules when the information is available. Most importantly, use these figures to understand game mathematics – not to predict the next random spin.